A variety of chart and candlestick patterns that represent the mood and actions of traders in financial markets are included in technical analysis. Technical indicators and these chart patterns assist traders in making better trading selections.
A “Rising wedge” bearish pattern is one of many price patterns that indicates a trend shift from upward to downward or the continuance of a bearish trend.
The usefulness of the trade pattern and the possibility that it will indicate an impending reversal on a chart are covered in this article.
What is a Rising Wedge?
Often referred to as a negative technical analysis chart pattern, the “Rising wedge” pattern appears at the peaks of an uptrend or in the midst of a decline and indicates a bearish price reversal.
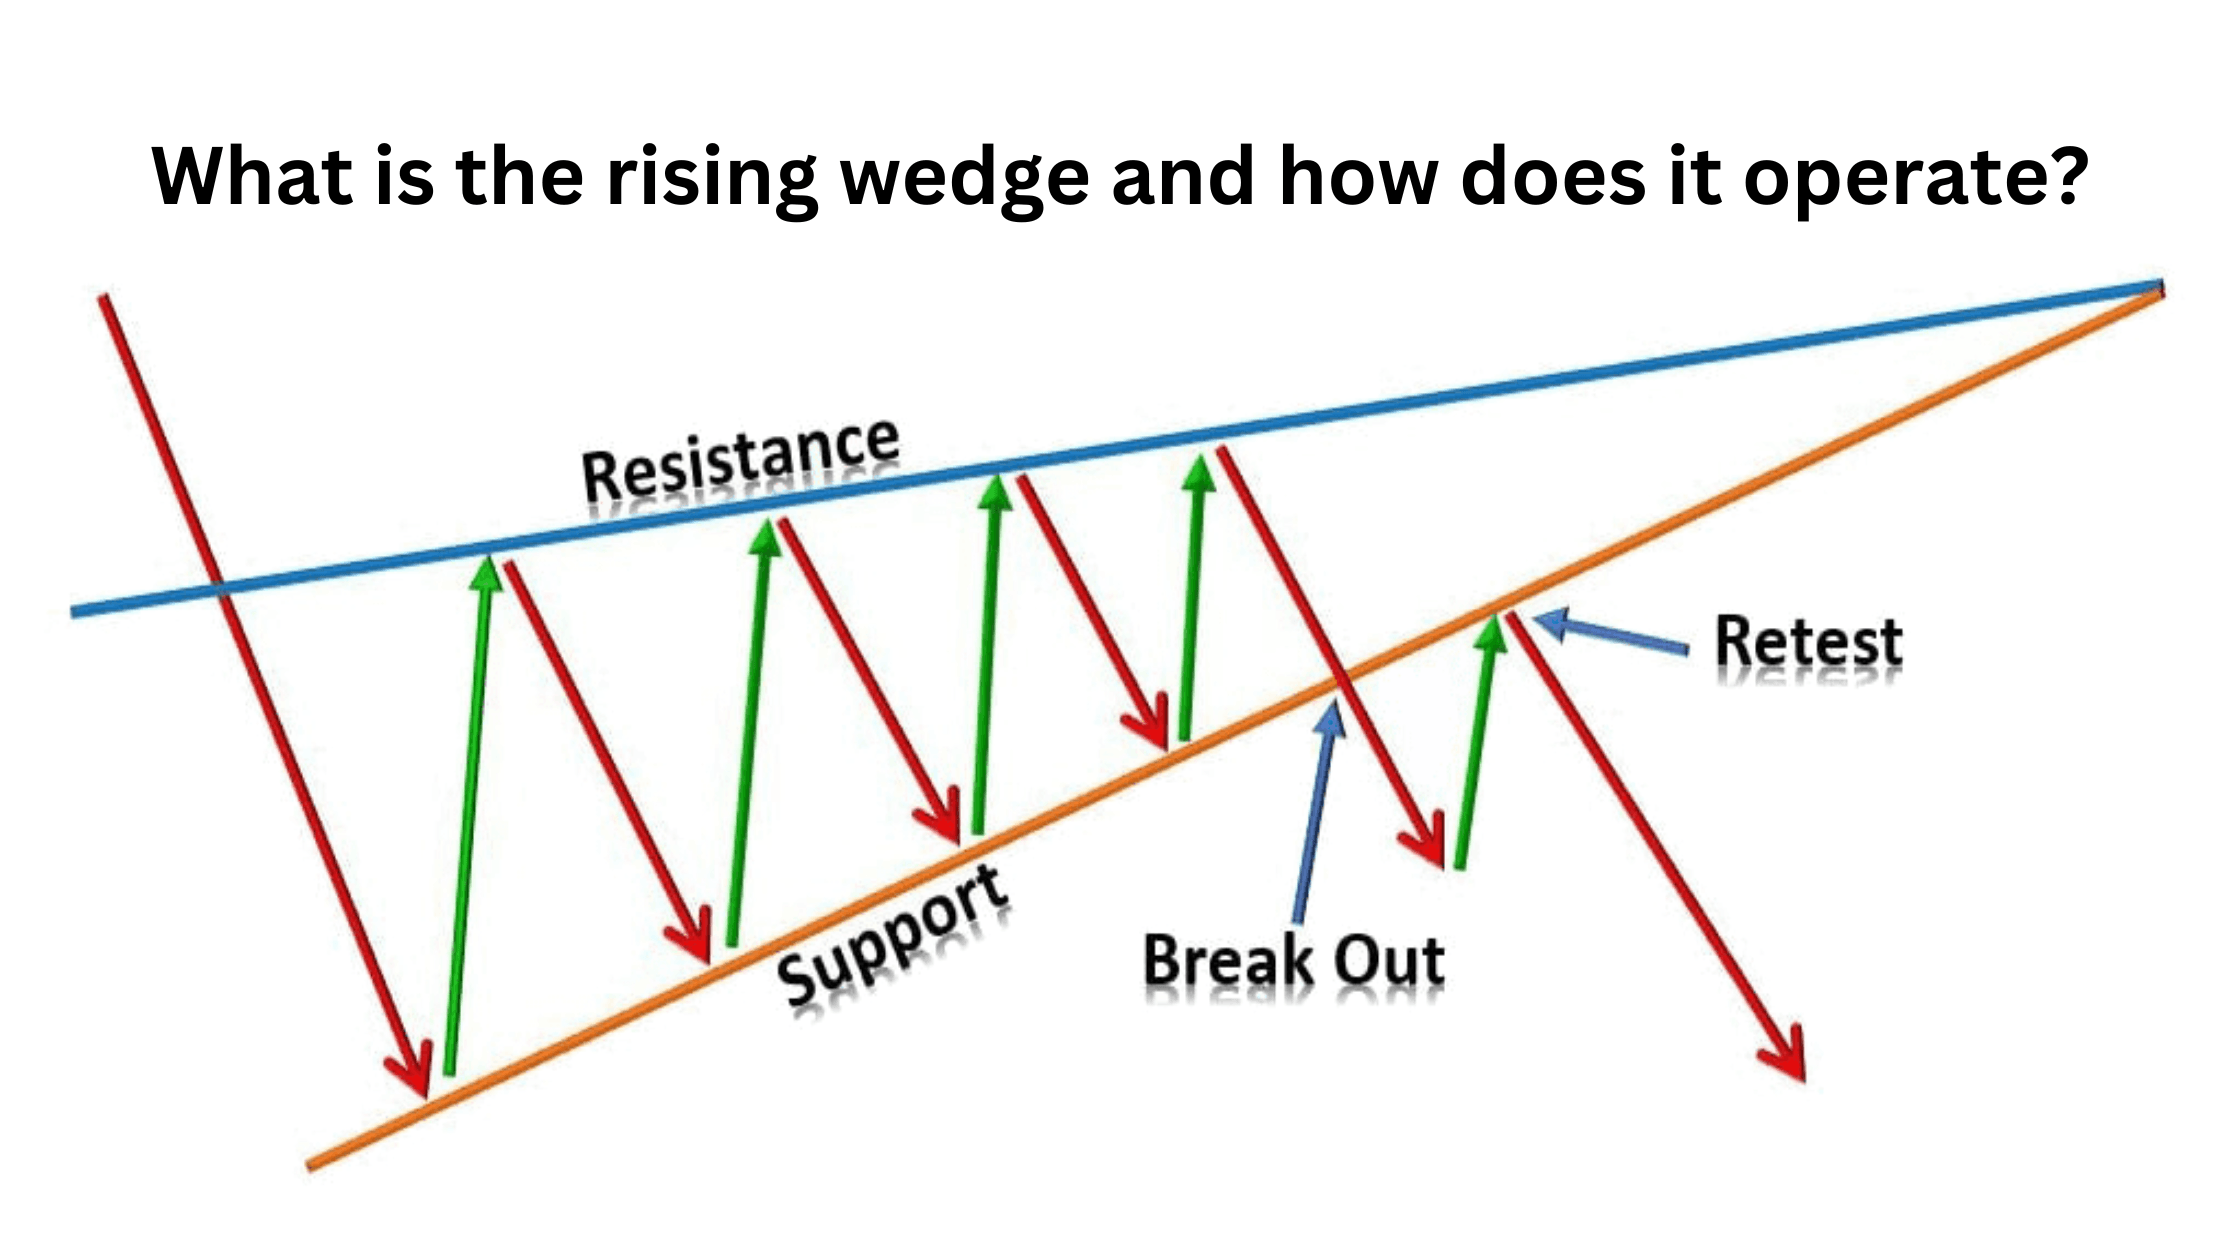
Skilled traders are able to identify the pattern on the chart with ease. With rising lows and higher highs, it is an ascending channel with a shrinking price pattern.
The pattern’s diagonal support line is notably steeper than the resistance line. This indicates that bullish pressure is gradually wearing off and that sellers are putting increasing pressure on the price.
A bearish trend reversal is indicated by the wedge’s shortening at the peak, which suggests a further breach of the diagonal support line. Open trades for short positions once the price breaks through the above pattern.
The price may turn around to test the support level following a breakout to the negative. A “Rising wedge” pattern is typically verified by a bounce back from the support line.
But when trading volumes are large, a support breakout typically happens hastily and without confirmation. To prevent missing out on a position, it is therefore wise to search for an entry into a short trade on shorter time frames.

How Do Rising Wedges Appear?
A sizable price configuration that shows up on longer time frames is known as a “rising wedge” pattern.
This sequence is followed by the pattern development at the peak of an uptrend or during a downtrend:
- The price progressively climbs inside the converging diagonal lines of support and resistance when there are little volumes. The bottom trend line has a sharper slope.
- Support and resistance levels gradually converge to form a wedge-shaped structure.
- As the pattern develops, the price highs and lows increase. The trading range gradually narrows between these positions.
- Trading volumes frequently decrease during a “Rising wedge” formation and rise when the pattern is disrupted.
- The price breaks through the top trend line at the pattern’s peak, signalling a price reversal and creating an opportunity for selling.
A “Rising wedge” pattern indicates a possible trend reversal and highlights the increasing market stress.

What Leads to Wedges That Rise?
A “rising wedge” pattern, which is impacted by the following variables, depicts shifts in market supply and demand:
- expansion of supply. Sellers enter the market when the pattern develops. Bulls initiate short bets and lock in profits from long positions, which causes the supply to rise quickly. A “Rising wedge” suggests a progressive weakening of buyers’ power, even though they still control the majority of the market.
- Despite enthusiastic purchases, the asset’s demand progressively declines as the pattern takes shape, slowing the asset’s price growth.
- Resistance levels, both historical and swing. Typically, a “Rising wedge” pattern appears at historical or swing highs, which are the points at which many short trades were first made.
- Both basic and psychological elements. It’s critical to examine the underlying causes influencing the asset’s value when identifying a “Rising wedge” pattern on the price chart. Positive news can occasionally cause the price to start rising following the pattern development rather than decreasing. Furthermore, there will be a larger downward movement the more market players recognize the pattern on the chart.
Examine the following Altria Group Inc. chart for an illustration of how a “Rising wedge” pattern affected the trend change.

The rising wedge pattern frequently denotes a trend continuance during a downturn. The 4-hour chart of Starbucks Corporation shares below shows an example of this pattern.

What Do Rising Wedges Mean?
A “Rising wedge” indicates major changes in the state of the market, despite the fact that it may appear simple and comparable to other patterns.
- change in trend. The quotes have turned lower as a result of the diagonal support line breakout within the pattern, which indicates that bears have gained the upper hand.
- decline in the positive momentum. Bullish movement in the contracting price range indicates that the strength of purchasers is waning despite the lows’ strong expansion.
- shift in the mood of the market. Market attitude is more cautious when a “Rising wedge” pattern develops.
- Price movement within a constricted ascending channel. Two convergent trend lines show how the security’s price has been consolidating and indicate the impending impetus during the pattern’s breakout.
- Drop in the volume of trading. Lessening bullish momentum in the market is indicated by declining trading volume during the “Rising wedge” pattern creation. Increasing market volume validates the power of sellers and suggests a possible downward reversal or reinforcement of bearish momentum when the price breaks above the wedge.
- historical peaks for pattern formation. The price struggles to continue climbing when a “Rising wedge” typically appears at historical resistance levels.
Consequently, a “Rising wedge” pattern creates opportunities for selling by alerting market players to the imminent change from an uptrend to a downturn.

How To Recognize The Pattern Of Rising Wedges
Step-by-step, let’s examine how a “Rising wedge” pattern was created on the 4-hour XAUUSD chart
.
- To begin with, you should identify critical levels of support and resistance in order to determine potential patterns.
- Next, visually locate a pattern close to the resistance line on the chart. Sharp price swings in an ascending, narrowing channel with higher highs and higher lows define the pattern.
- In addition, this pattern’s ascending structure has a less steeply sloping resistance line and a steeper support line. The price is forming a wedge as it moves within a smaller trading range.
- Another crucial factor is the market volume. Volume should be modest as the pattern develops, indicating that bulls are unable to drive the price upward.
- You should wait until the price breaks through the pattern to confirm that the wedge is rising.
On the gold chart, a “Rising wedge” pattern has shown during a bullish trend. After it was finished, the cost started to drop quickly. In essence, the pattern has provided indications to open short positions and alerted traders to the impending trend change.

Trading Strategies for Rising Wedge
You should research the guidelines for entering and leaving the market in accordance with the “Rising wedge” pattern if you want to trade it successfully. Early warning signs of a trend reversal or the continuance of a downward movement are provided by the pattern. Therefore, it’s crucial to hold off on making trade decisions until after a pattern’s lower boundary breakout and confirmation.
Let’s explore two examples of trading a “Rising wedge” pattern below.
Trading a “Rising wedge” in a positive trend
Opening short positions when the pattern forms at the high, near the end of the uptrend, is the trading strategy for a “Rising wedge” pattern in a bullish trend. Let’s use the hourly chart of the EURUSD currency pair to examine this technique in more detail.

The EURUSD price is moving higher for a longer period of time on the chart. A “Rising wedge” then develops in the 1.2273–1.2350 area.
Following the bulls’ failed attempt to break through the historical resistance of 1.2350, the pattern’s lower boundary was breached, and this was accompanied by stronger volumes, which became an indication to initiate short trades.
In addition, the chart displays an impulse breakout of the bottom boundary of the uptrend. Following the breach, the price challenged the lower boundary once again, providing the last evidence of the uptrend’s reversal.
A stop-loss order in this case ought to be positioned above the “Rising wedge” pattern and the crucial resistance level of 1.2350. 1.2211 is the closest profit target. By putting the order at 1.2126 and 1.2057, you can also maximize the possible profit and partially secure earnings.
Using a “Rising wedge” trade during a negative trend
When trading a “Rising wedge” in a downtrend, short trades are opened as soon as the pattern starts to take shape. Let’s use the 4-hour ETH/USD chart to examine this approach.

The chart illustrates how a “Rising wedge” has formed inside the downtrend over a broad range of prices. A brief wedge-shaped upswing has alerted investors to the likelihood that the gloomy trend will persist.
Higher trading volumes and the pattern’s lower boundary breakout indicate when to start short trades.
In this instance, at the 1723.92 level, a stop-loss order ought to be positioned above the pattern’s lower line.
According to the accompanying chart, the distance between the lower and upper boundaries at the start of the pattern development equals the price potential drop trajectory following the breakout. That means that 1628.46, 1557.88, and 1431.86 are the goal levels. Most trades can be closed after these benchmarks are met.
Verification for the Rising Wedge Pattern
“Rising wedge” patterns and indications need to be confirmed, just like any other patterns or indicators in technical analysis.
Making money in the market is the aim of any trader or investor. As a result, the market’s many confirming signals point to more profit potential and lower risk.
- The pattern’s bottom boundary breakout is the most significant piece of pattern confirmation.
- An even stronger confirmation of a “Rising wedge” pattern is a discernible spike in trading volumes that happens after the price breaks through the pattern, indicating a change in sentiment and general market activity.
- Analyzing technical indicators and interpreting candlestick patterns to obtain signals is another method of verifying the pattern.
Let’s see a confirmation example of the “Rising wedge” pattern on the 4-hour Dow Jones Index chart.

A “Rising wedge” pattern appeared prior to the YM index entering a brief bearish trend. The RSI indicated that the price had spent a considerable amount of time in the overbought zone before the pattern’s lower boundary breakout. The values of the indicator then abruptly dropped.
The MACD indicator, meanwhile, has decreased in the negative zone after crossing the zero barrier. In addition, the MFI indicates that the asset’s liquidity is leaving along with a rise in tick volume. These signals mark the start of the sales process.
An additional indication of the strength of the bearish trend is the index market price’s decline below the SMA20 level and the VWAP point.
Consequently, the basis for opening is provided by five “Rising wedge” pattern confirmation signals.
Conclusion
In volatile markets, a “rising wedge” pattern aids traders in assessing the direction of the market and the relative strength of bulls and bears.”Rising wedge patterns suggest that an uptrend is about to transform into a downtrend, and they may also suggest that the downtrend will continue. In addition, trading this pattern is not too difficult, and the indications it produces are very trustworthy. But it’s critical to use candlestick patterns and technical indicators to support the confirmation of a “Rising wedge”. Getting a free LiteFinance demo account is the easiest method to learn how to spot and use a “Rising wedge” pattern. With a variety of trading instruments and a flexible web terminal, you may hone your trading abilities before